Weather map
Maps displaying meteorological features for research and forecasting.

NOAA Library · Public domain
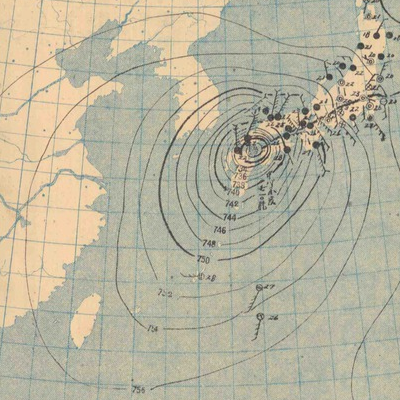
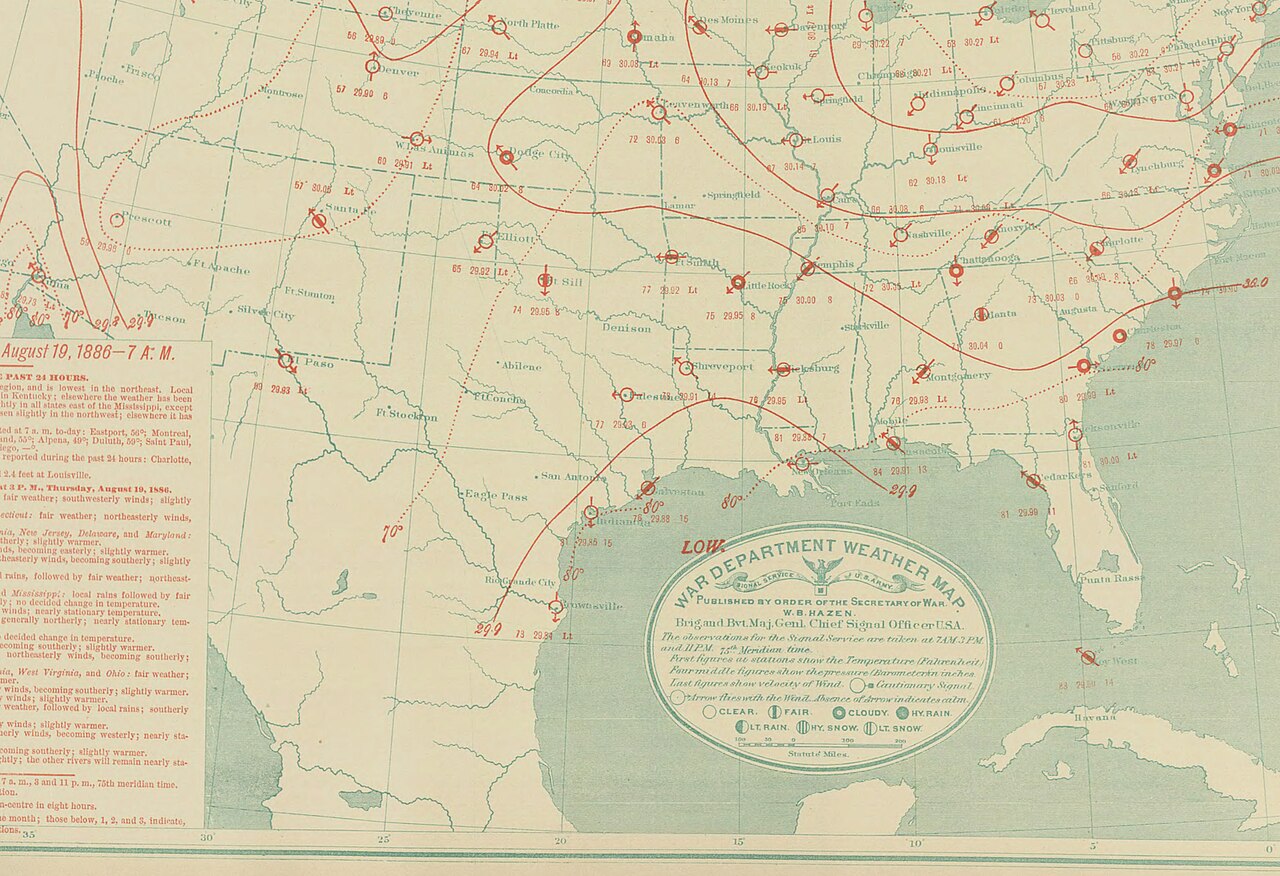
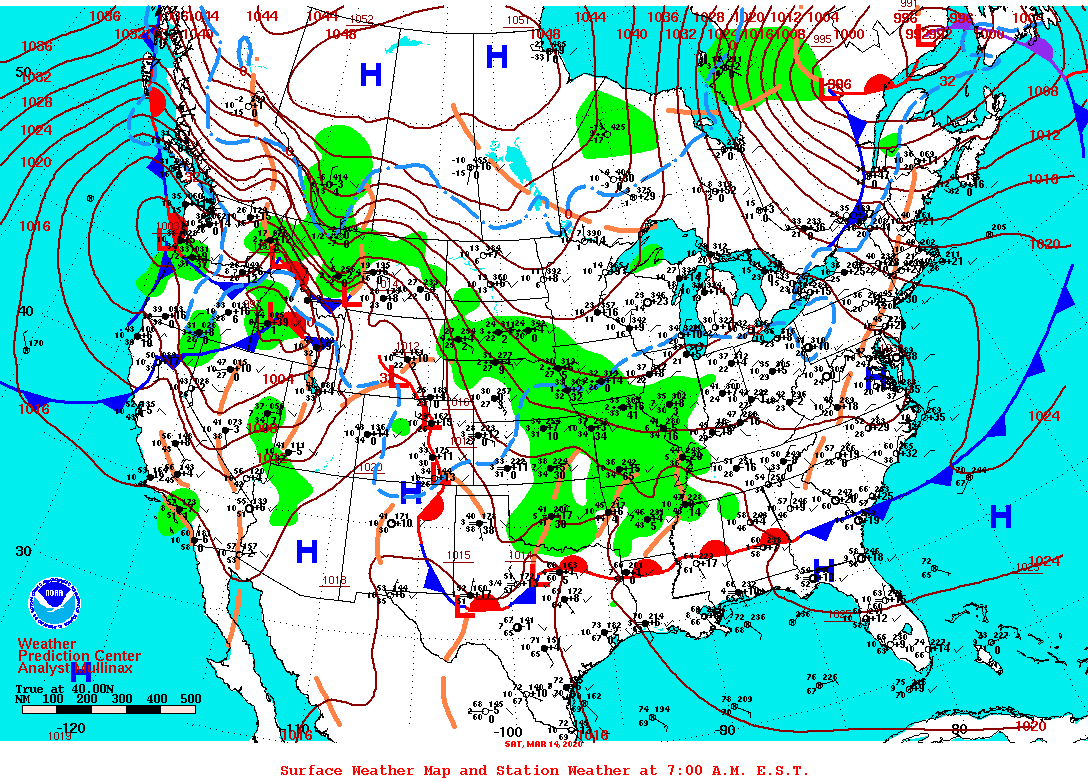
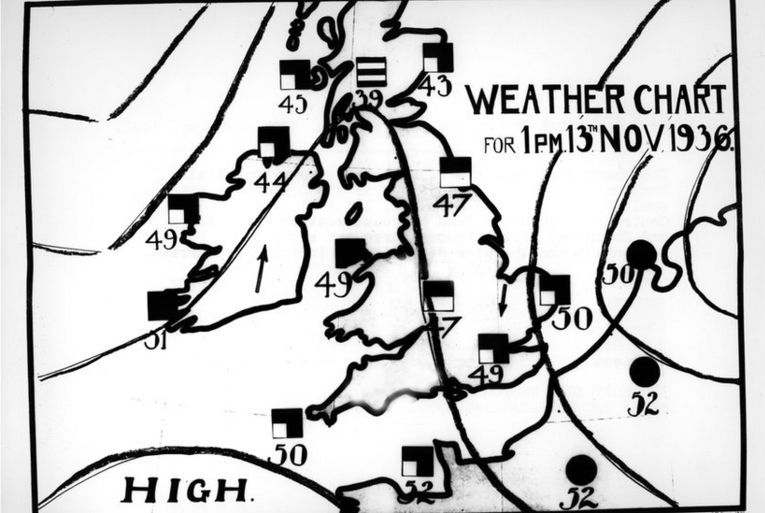
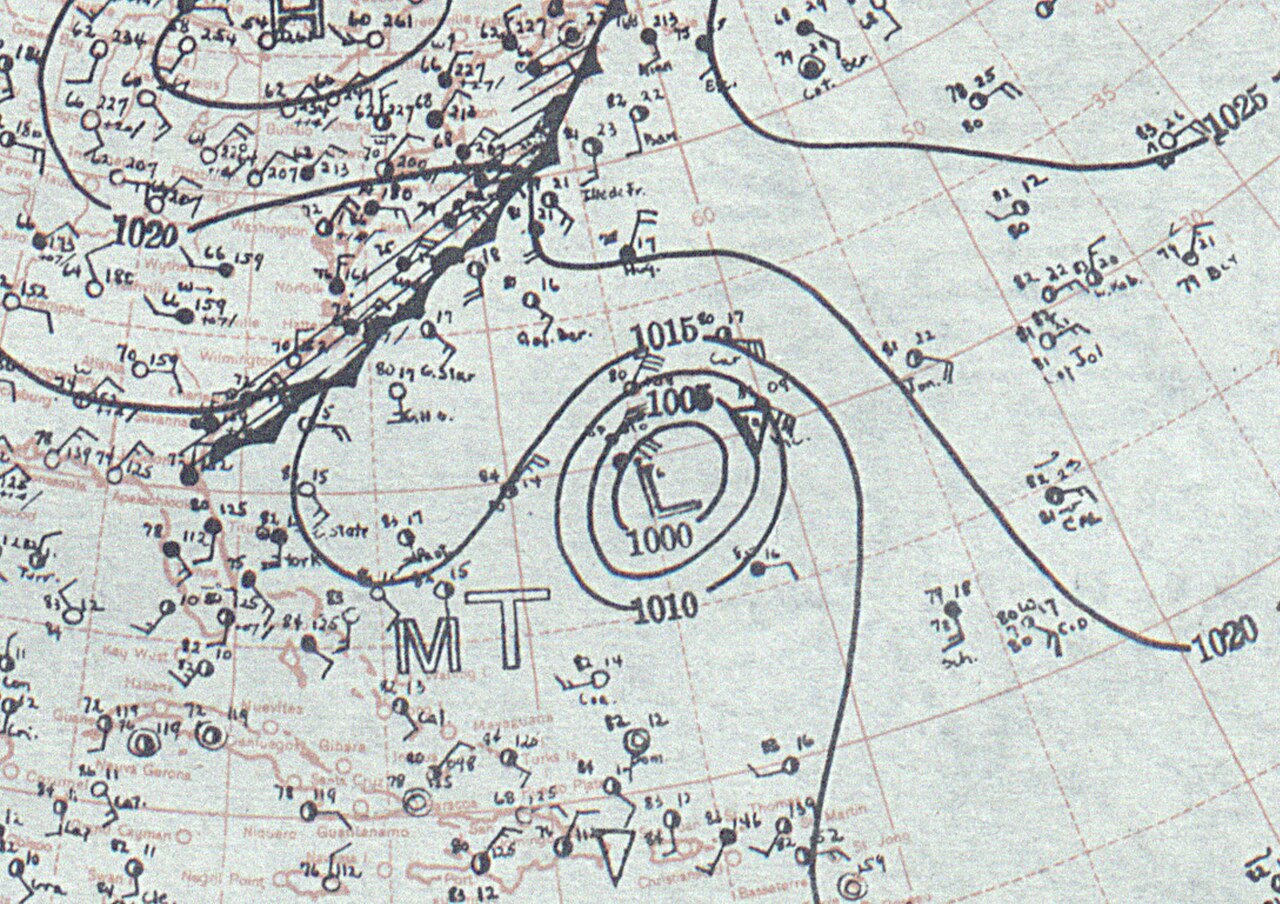
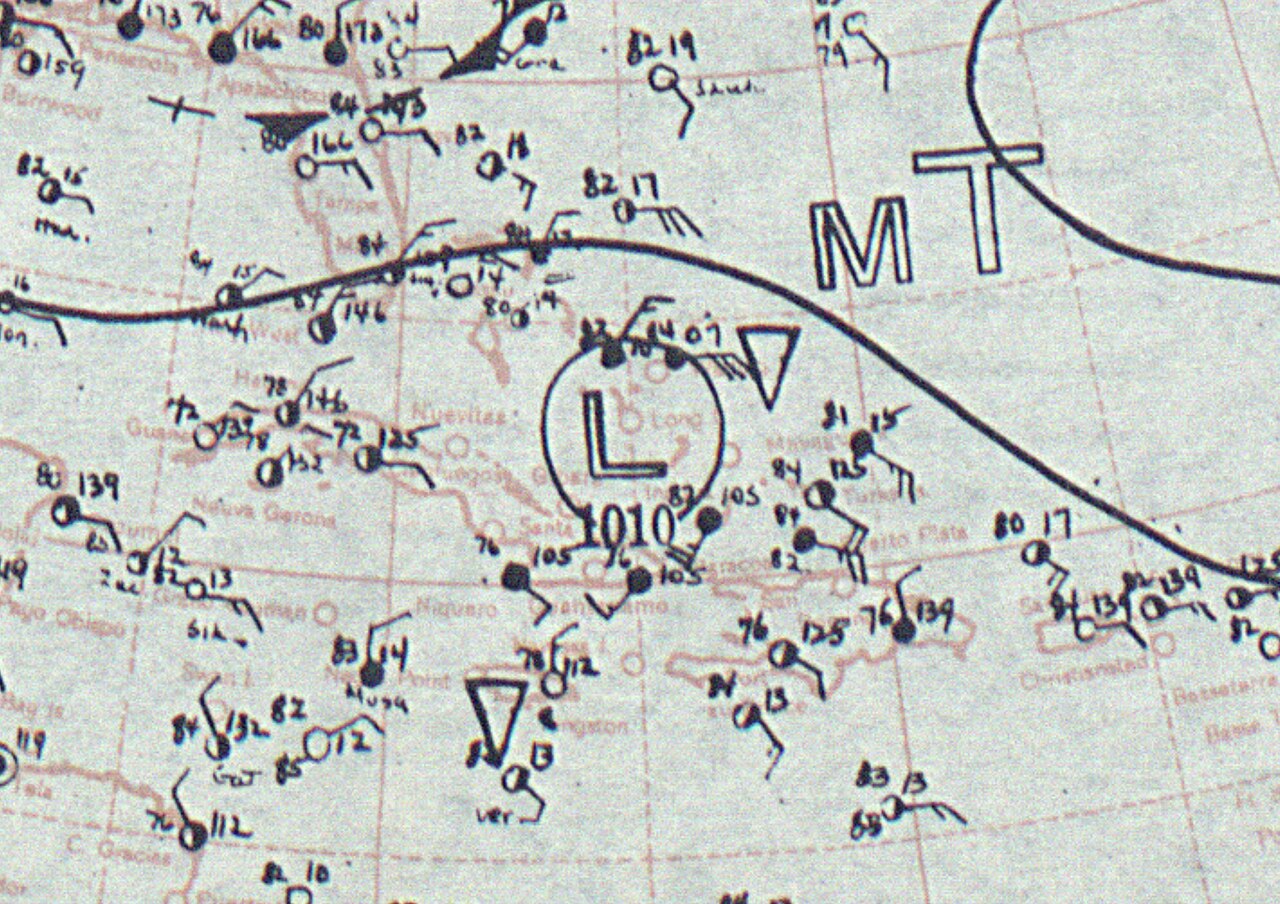
A weather map, also known as a synoptic weather chart, displays various meteorological features across a particular area at a particular point in time. Such maps have been in use since the mid-19th century and are used for research and weather forecasting purposes.
- first_newspaper_weather_map
- The Times, using data from the Meteorological Office
- key_early_figure
- Francis Galton
- key_early_figure_2
- Urbain Le Verrier
- key_early_figure_3
- Robert FitzRoy
Lore & Background
The use of weather charts in a modern sense began in the mid-19th century to devise a theory on storm systems. During the Crimean War, a storm devastated the French fleet at Balaklava, and Urbain Le Verrier showed that a chronological map could have predicted its path. He used it to prove that air circulated clockwise around high pressure, coining the term 'anticyclone'. He also modified the pantograph to inscribe maps onto printing blocks, leading to The Times printing the first newspaper weather map. The introduction of country-wide weather maps required national telegraph networks for real-time data gathering. In the US, the Smithsonian Institution developed a network of observers between the 1840s and 1860s, later inherited by the U.S. The use of frontal zones on weather maps began in the 1910s in Norway, with polar front theory attributed to Jacob Bjerknes. The term 'front' came into use because the leading edge of air mass changes resembled military fronts of World War I.
Reader's Guide
Weather maps are fundamental tools in meteorology, enabling the visualization of atmospheric conditions at a given time. They allow for the identification of weather fronts, pressure systems, and wind patterns, which are essential for forecasting. The development of the weather map in the mid-19th century marked a turning point, as it provided a systematic way to analyze storm systems and predict their movement. The work of Francis Galton, who created the first weather map and coined 'anticyclone', and Urbain Le Verrier, who demonstrated the predictive potential of such maps, laid the groundwork for modern synoptic meteorology. The integration of telegraph networks and standardized time made real-time national weather maps possible, while later innovations such as frontal analysis, constant pressure charts, and automated plotting refined the accuracy and utility of these maps. Today, weather maps incorporate satellite imagery, radar, and model-derived fields, and are issued by multiple centers in unified analyses. They remain indispensable for research, aviation, maritime navigation, and public weather forecasting.
Did You Know?
- The term 'anticyclone' was coined by Francis Galton to describe clockwise air circulation around high pressure.
Origins: From Naval Disaster to the First Chart
The modern weather map was born out of military tragedy and scientific curiosity. During the Crimean War, a violent storm wrecked the French fleet anchored at Balaklava. The French scientist Urbain Le Verrier later demonstrated that had a chronological chart of the storm's progression been produced in advance, the fleet could have anticipated its path and sailed to safety. This insight reached England, where Francis Galton, already aware of Robert FitzRoy's early forecasting experiments, decided to test the idea himself. In October 1861 he collected observations from weather stations spread across the country and plotted them onto a single map using a symbol system of his own devising. The result was the world's first weather map. Galton used it to demonstrate that winds circulate clockwise around regions of high pressure, a phenomenon he named the anticyclone. He also went further than mere research: he adapted a pantograph, a drawing-copying instrument, to transfer his chart onto printing blocks. The Times of London then became the first newspaper to publish a weather map, drawing its data from the Meteorological Office.
The Infrastructure That Made National Charts Possible
A weather map covering an entire country is only as good as the speed at which data arrives and the consistency of the clock by which it is recorded. Both requirements demanded new technology. In 1847 the Manchester Examiner newspaper made what appears to be the first attempt to gather weather observations from distant counties via the electric telegraph, querying stations in the eastern counties and appending the returned readings to its pages. Around the same year, Britain inaugurated Greenwich Mean Time to synchronize its railway network, a standardization that would prove equally vital for meteorology: without a shared clock, observations from different regions could not be meaningfully combined into a single snapshot of the atmosphere. Across the Atlantic, Joseph Henry's leadership of the Smithsonian Institution drove the construction of an observer network spanning much of the central and eastern United States between the 1840s and 1860s. Congress later transferred that network to the U.S. Army Signal Corps between 1870 and 1874, which then extended coverage to the West Coast. Yet even this expanded system suffered from inconsistent local times, and the United States did not fully adopt standardized time zones until 1905, when Detroit finally set its clocks to the national standard.
From Norwegian Coasts to Three-Dimensional Air
The concept of weather fronts emerged in the 1910s along Norway's coastline, where Jacob Bjerknes and his colleagues built a polar front theory from a network of observation stations maintained during World War I. Their key insight was that the primary inflow feeding a cyclone was not spread evenly but concentrated along two distinct convergence lines: one stretching ahead of the low-pressure center, later called the warm front or steering line, and another trailing behind it, the cold front or squall line. Cloud bands and rainfall clustered along these zones, and the idea naturally extended into the broader notion of air masses. The term 'front' itself was borrowed from military vocabulary, since the leading edges of shifting air masses visually resembled the battle lines of the Great War. Understanding the full three-dimensional architecture of a cyclone, however, had to wait until upper-air observation networks came online in the 1940s. In the United States, formal frontal analysis on surface charts only began in late 1942 with the opening of the WBAN Analysis Center in downtown Washington, D.C. Constant-pressure charts followed: the Daily Weather Map series launched in 1948 at the 700 hPa level, roughly 3,000 metres above sea level, and by May 1954 the 500 hPa surface was being analyzed as well.
Automation, Integration, and the Digital Turn
The transition from hand-drawn charts to computer-generated analyses unfolded over several decades and across multiple countries. In the United States, the push to automate map plotting started in 1969 and was largely complete by the 1970s. India's Meteorological Department launched a parallel automation effort in the same year, while Hong Kong finished converting its surface plotting to automated systems by 1987. A qualitative leap arrived in 1999, when workstation software became capable of layering satellite imagery, radar data, and model-derived fields such as atmospheric thickness and frontogenesis directly beneath surface observations on a single display. In the U.S., this was realized when legacy Intergraph workstations were replaced by n-AWIPS systems. Two years later, in 2001, the National Weather Service consolidated the surface analyses produced by four separate centers into a single Unified Surface Analysis, issued every six hours. More recently, advances in both meteorological science and geographic information systems have opened the door to finely tailored products that go well beyond the traditional weather map, allowing forecasters to match atmospheric information precisely to the geography and needs of a given audience.
Gallery
Frequently Asked Questions
What is a weather map?
A weather map, often called a synoptic weather chart, is a visual snapshot that plots meteorological features across a defined region at a single moment in time. It serves both scientific research and day-to-day forecasting needs.
Which newspaper first printed a weather map for its readers?
The Times was the first newspaper to publish a weather map, drawing on data supplied by the Meteorological Office.
Who were the key early figures behind weather mapping?
Francis Galton, Urbain Le Verrier, and Robert FitzRoy are widely recognized as the pivotal pioneers who shaped the discipline in its formative years.
More in Maps & Their Symbols 1-24
Elsewhere in the Maps & Their Symbols universe
Spotted an error? Know more?
This is a living reference — every entry is fact-audited, and reader corrections feed straight into our audit queue. Suggest an edit · See this site's audit record